Watch every engine.One free plugin.
Install the OpenShare Gateway plugin on any Mirth Connect or OIE server and real-time monitoring lights up in the browser: channel health, throughput trends, and error alerts. No agent, no subscription, no per-server fee.
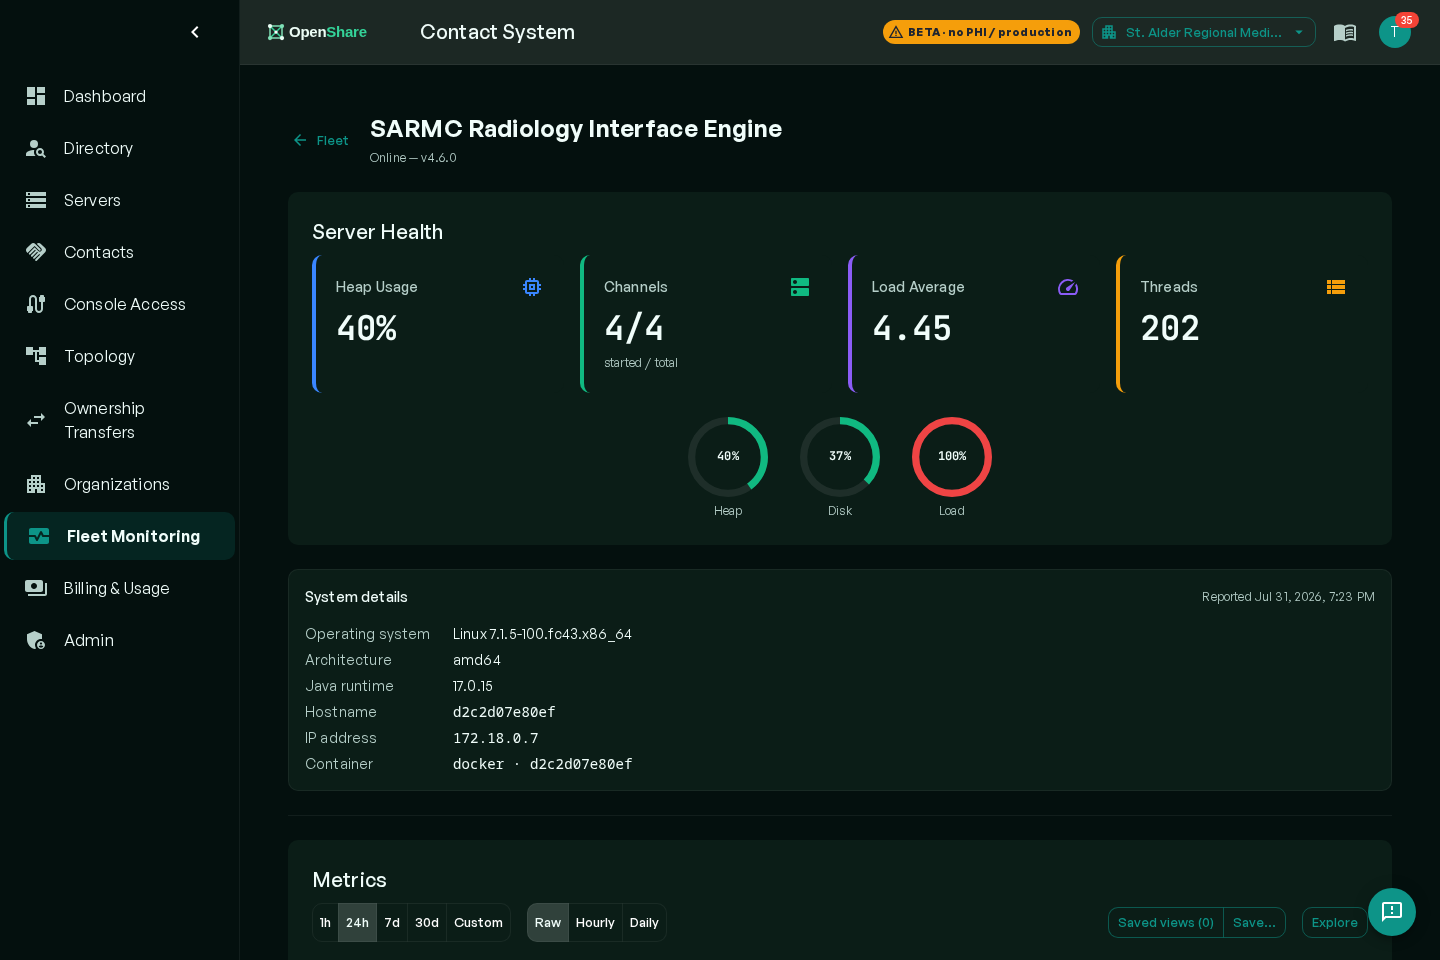
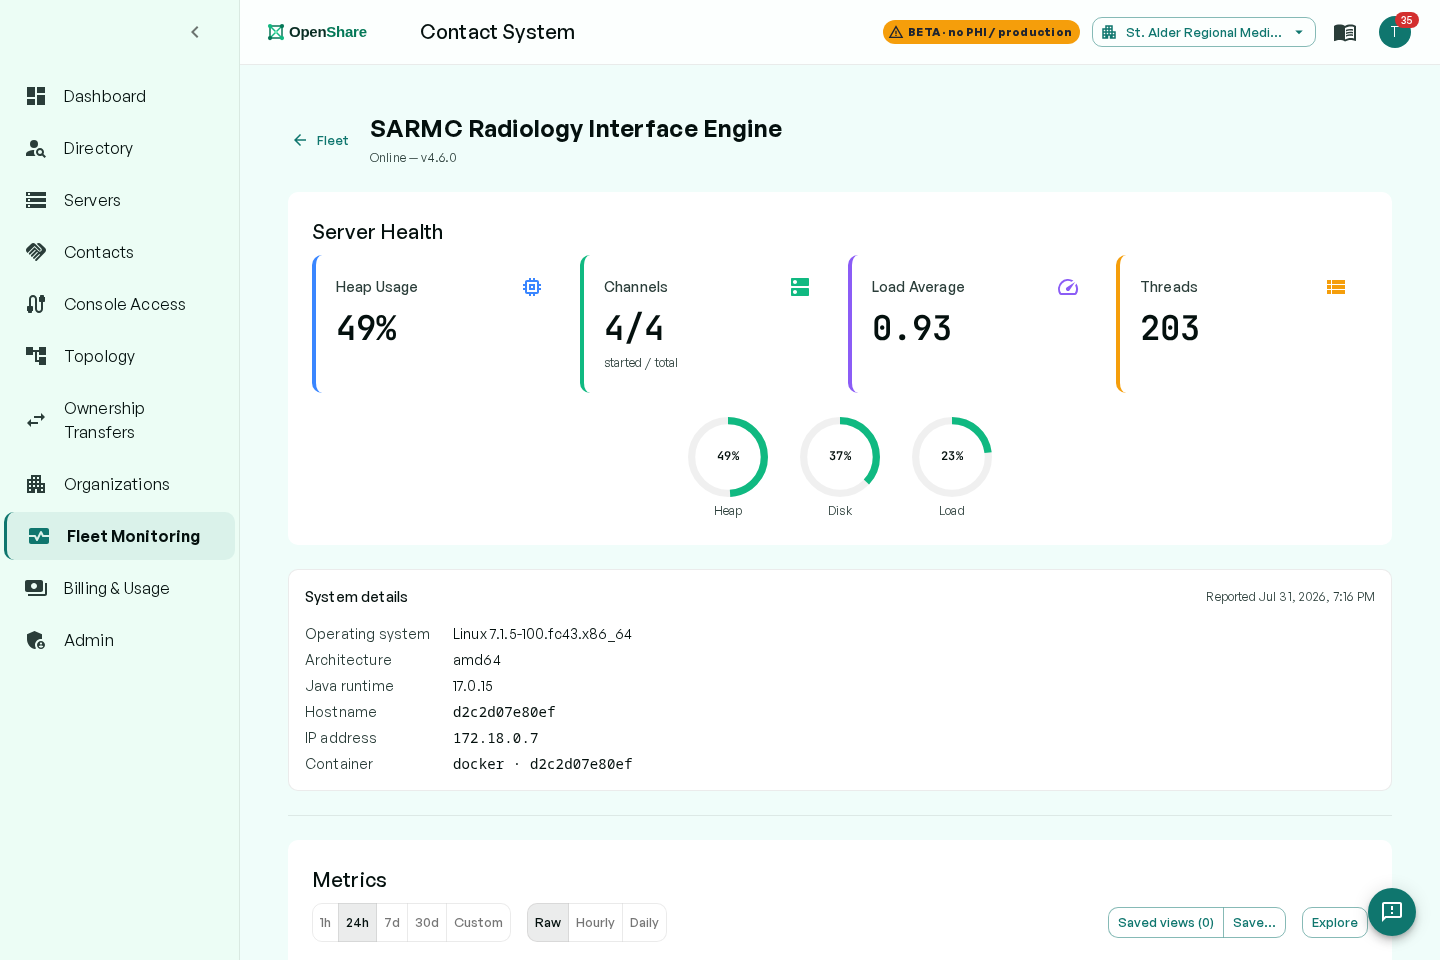
Real monitoring, built into the plugin you already install.
Everything you need to know the state of your integration engines, from a single browser tab, on any device.
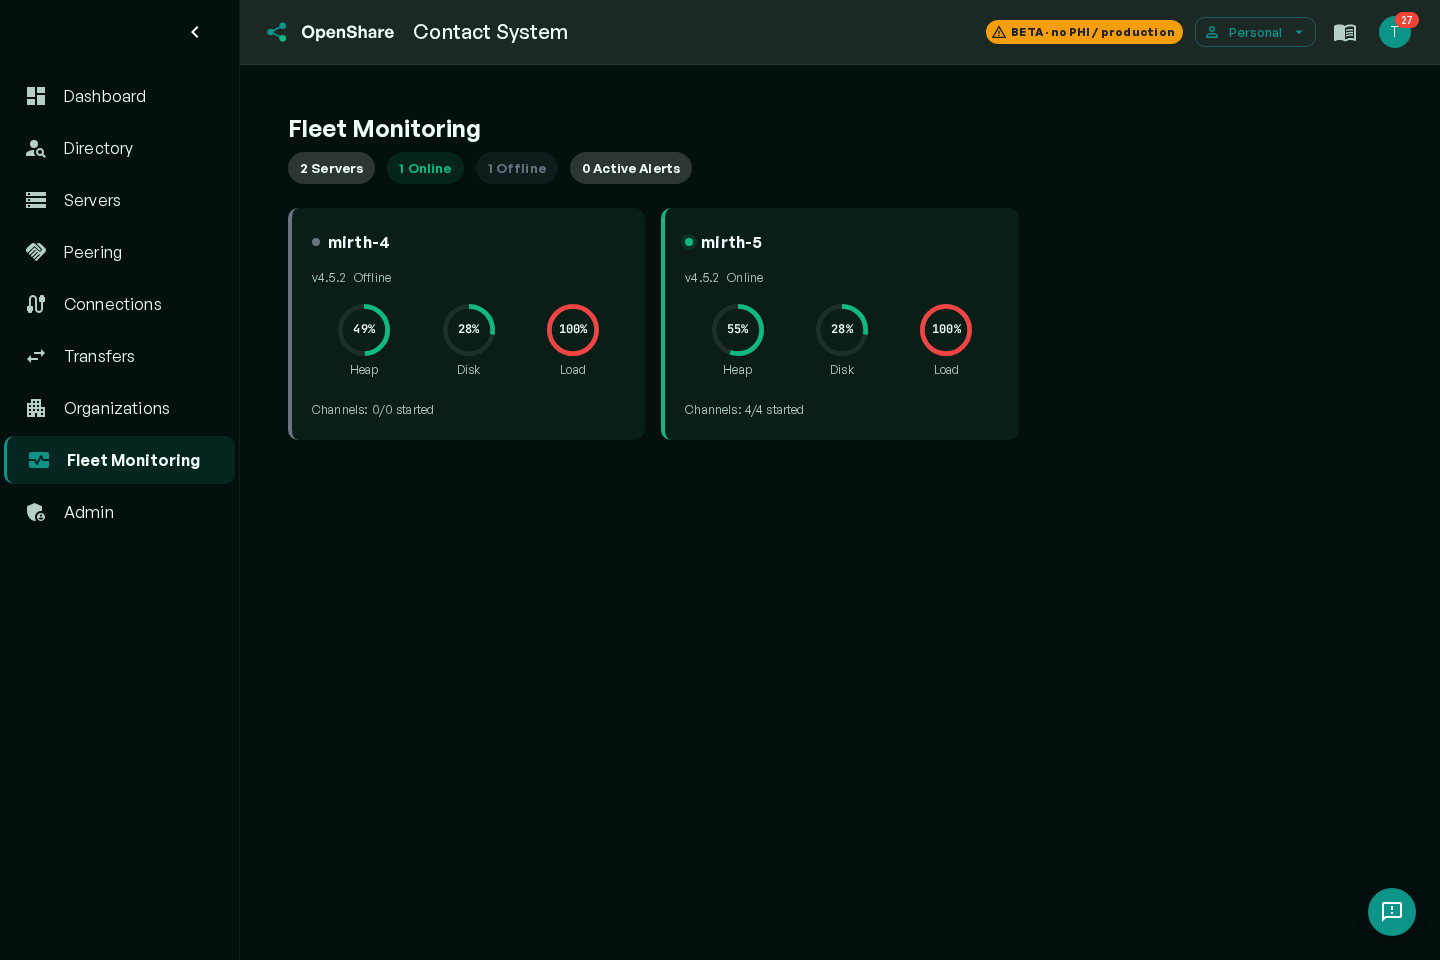
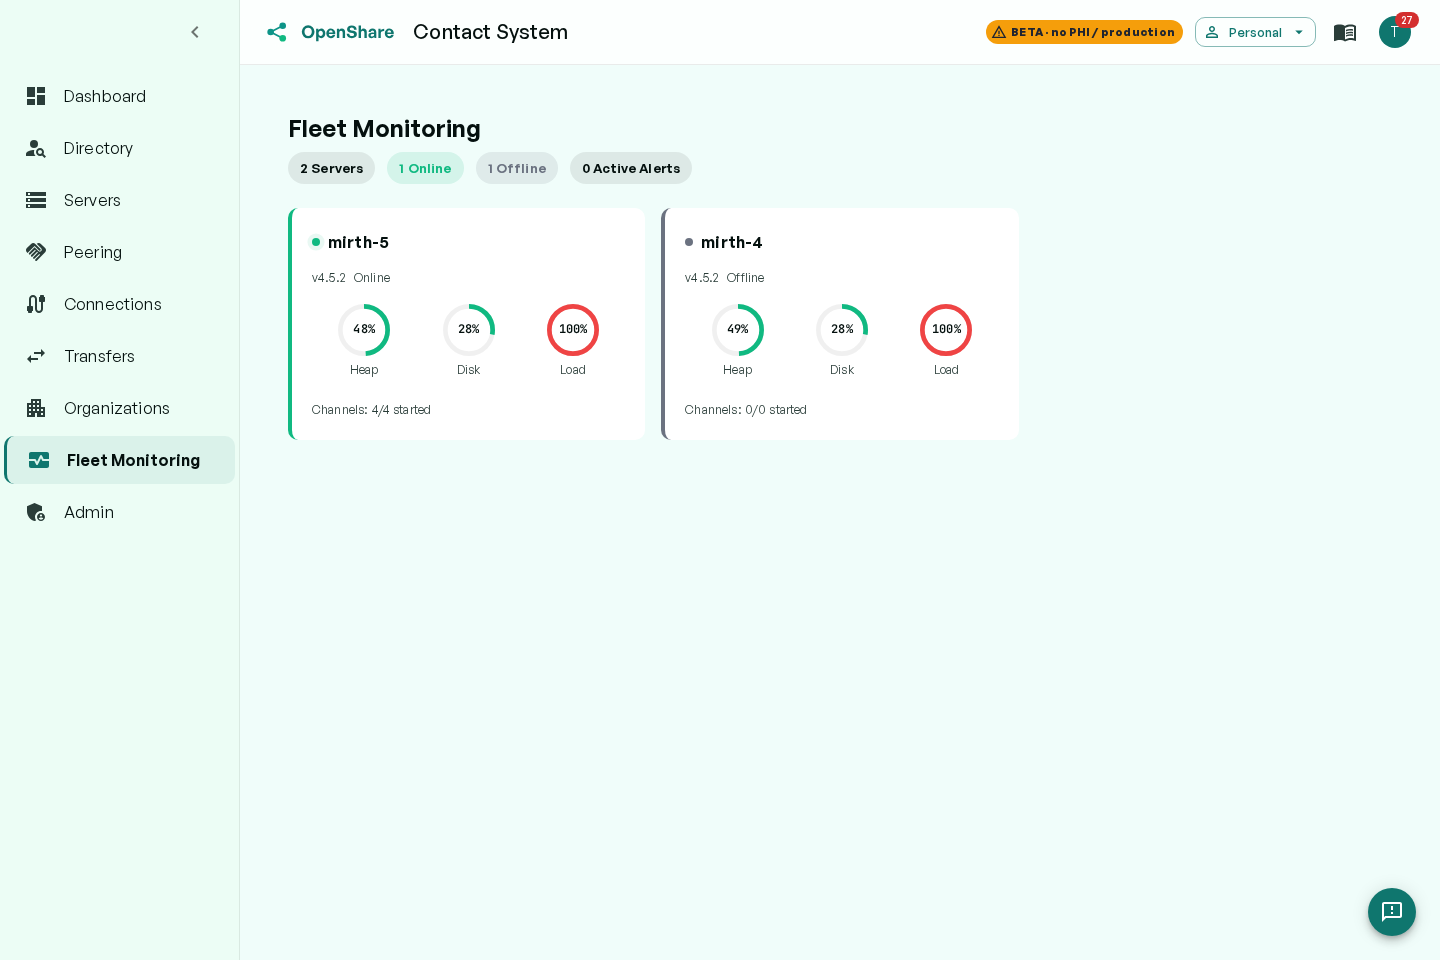
Every server, online or offline, in one view.
See heap, disk, and load for each connected engine, how many channels are started, and whether any server has an active alert. Spot the one machine that needs attention before anyone files a ticket.
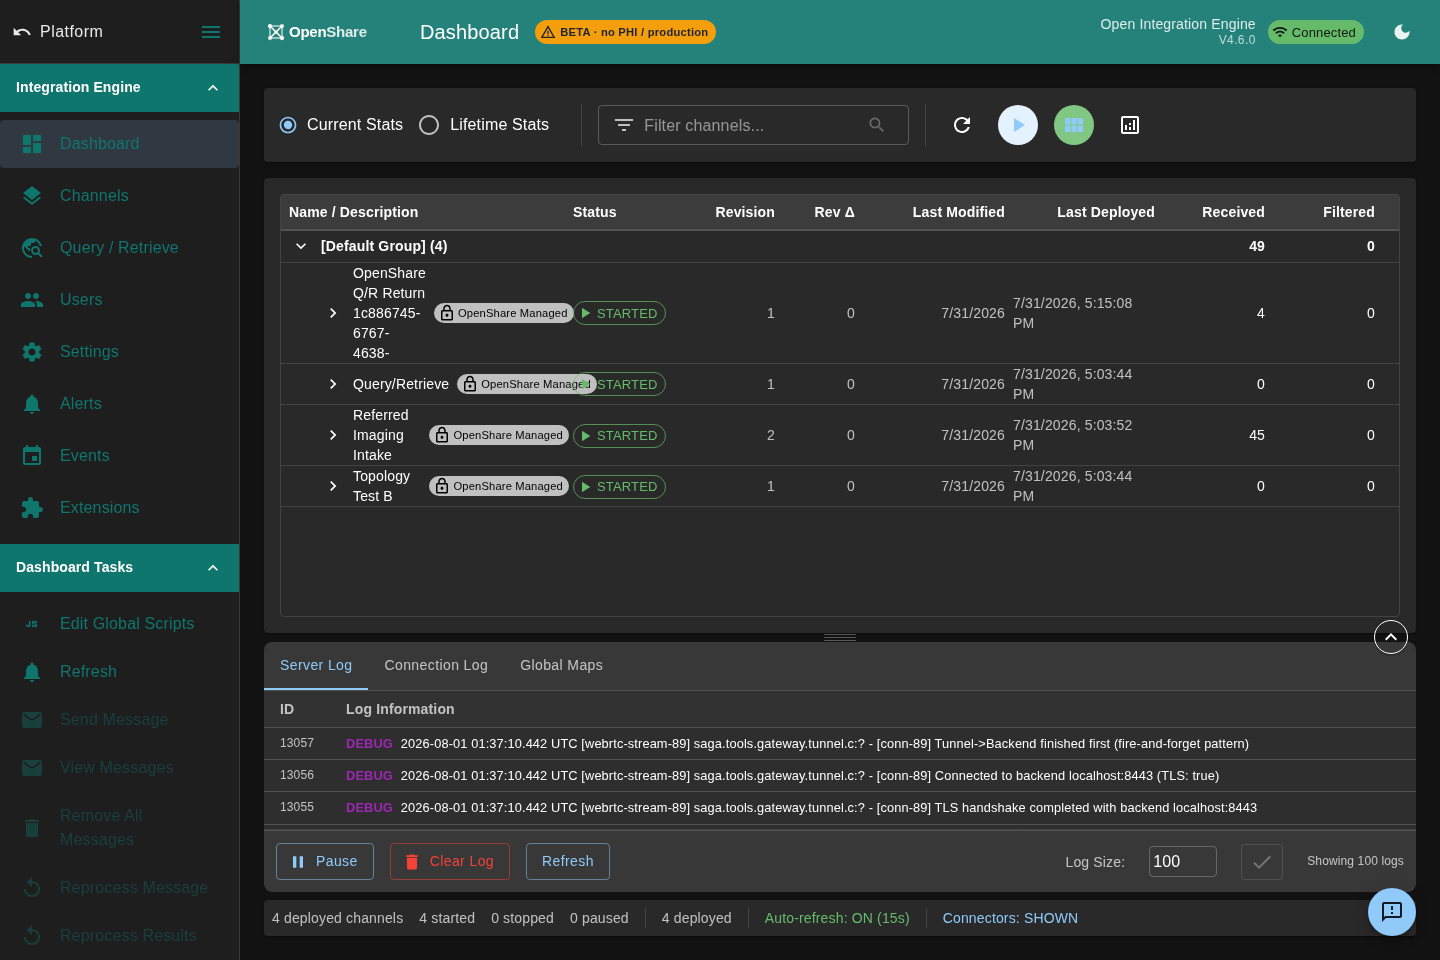
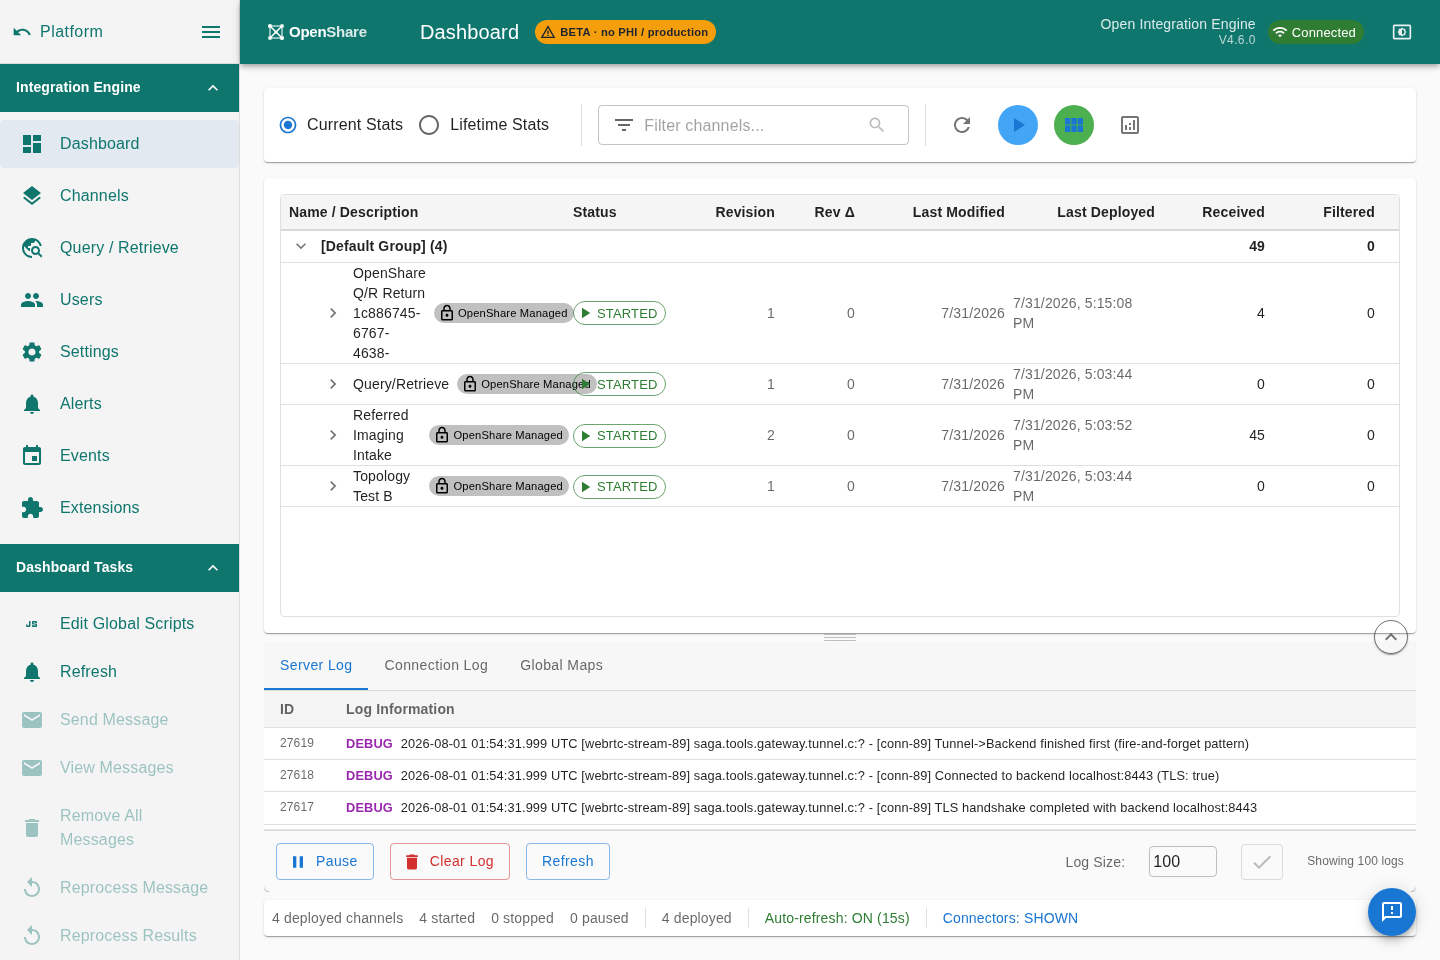
Live channel status and throughput.
Watch received, filtered, queued, and sent counts update in real time across every channel, with the server log right underneath. The same dashboard the Java client gave you, now in the browser.
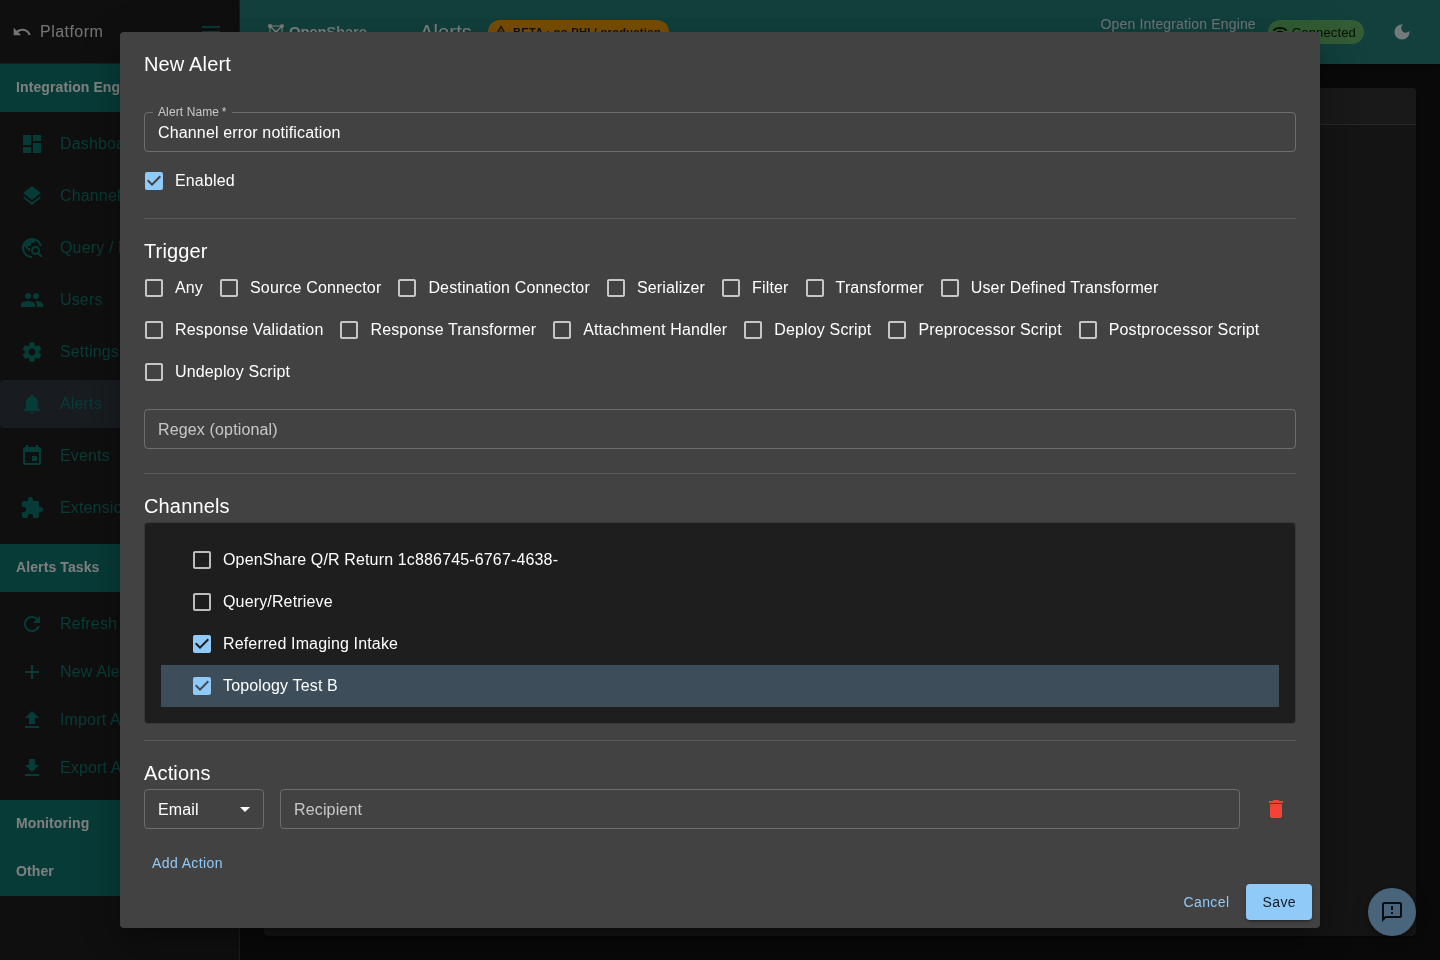
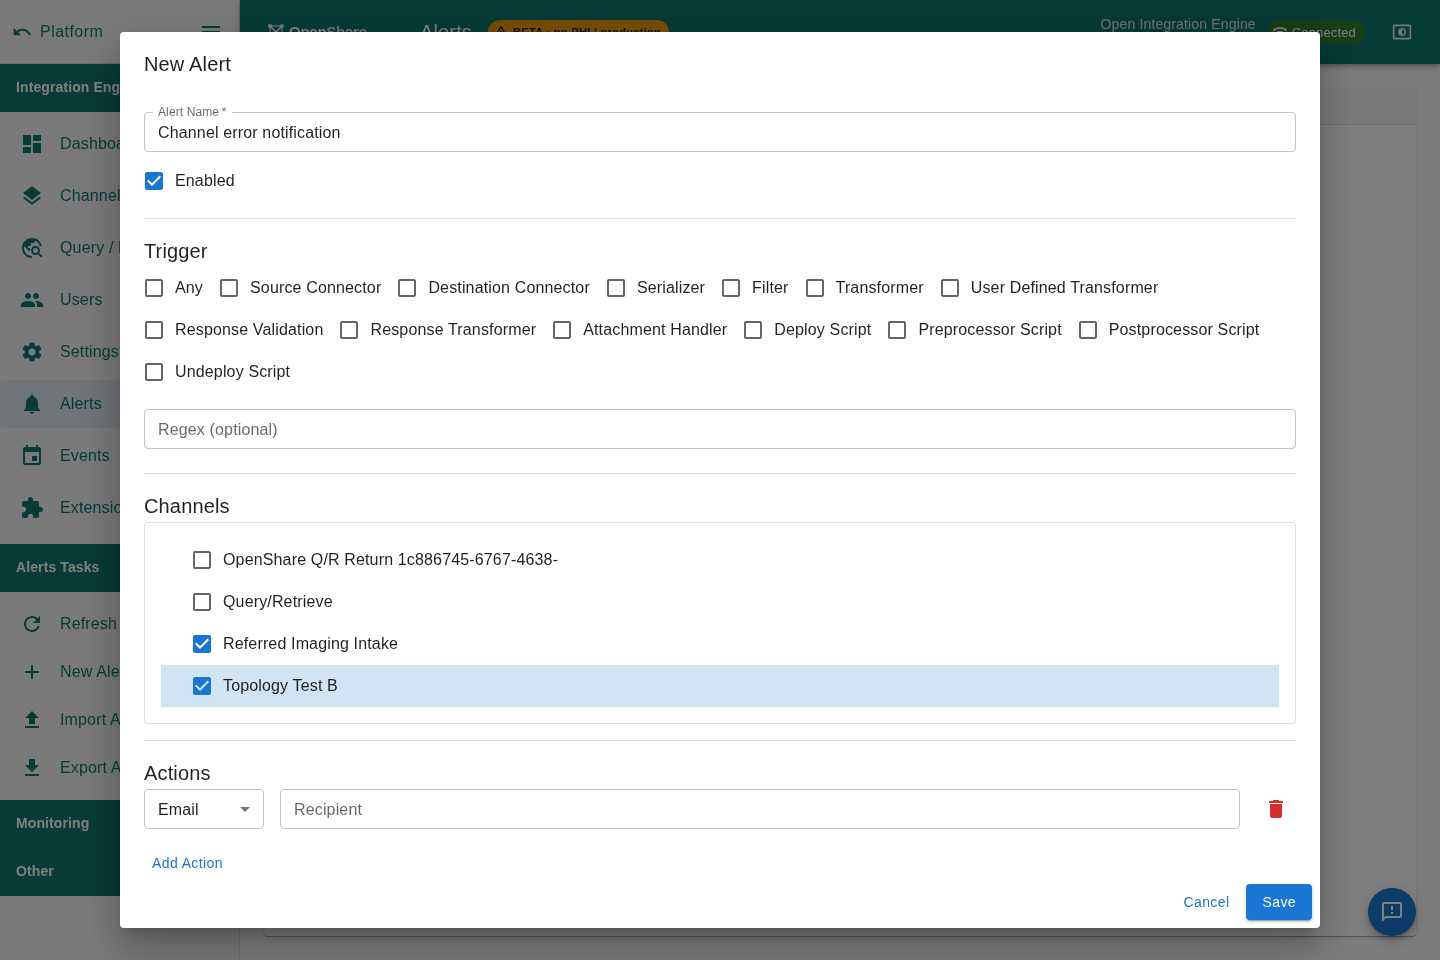
Hear about problems before your users do.
Configure alerts on errors and queue depth, then get notified the moment a channel goes down or comes back. No more discovering a dead interface hours later, when the missing messages start getting noticed.
Live in three steps.
Install the Gateway plugin
Drop the Gateway plugin into your Mirth or OIE extensions folder. It dials out over an encrypted tunnel, so no VPN and no inbound ports.
Monitoring lights up
Your server appears in the Console immediately, with dashboards, trends, and alerts live. Nothing else to configure.
Frequently asked questions.
Does monitoring cost anything?
No. OpenShare Monitoring is completely free. You install the OpenShare Gateway plugin on your Mirth Connect or OIE server and monitoring lights up automatically in the OpenShare Console. There is no separate agent, no monitoring subscription, and no per-server fee.
How does the plugin connect to the Console?
The Gateway plugin makes an outbound encrypted connection from your server to OpenShare, so there is no VPN and no inbound firewall port to open. Your browser then connects to the OpenShare Console to see dashboards, alerts, and trends for every server that has the plugin installed.
What engines does it support?
The Gateway plugin is fork-agnostic. It works with Mirth Connect (all versions through 4.5.2 open-source and 4.6+ commercial), the Open Integration Engine (OIE), BridgeLink, and any other Mirth Connect-compatible engine. Same plugin, same monitoring, regardless of fork or version.
Does PHI leave our servers?
No PHI is transmitted. The Gateway plugin streams PHI-free telemetry only: channel status, message counts, queue depths, and uptime. Message content never leaves your server.
What can I see on the monitoring dashboard?
Every server with the Gateway plugin reports channel and message dashboards, throughput trends, error and queue-depth alerts, and engine uptime and health. Views are mobile-friendly, so you can check your interfaces from a phone. It all appears in the browser-based OpenShare Console with no desktop client required.
Do I get alerts when something goes wrong?
Yes. Monitoring watches channel errors, queue depth, and engine uptime, and surfaces them as alerts in the Console so problems are visible before they turn into outages. Because the plugin keeps a live connection to every server, dashboards and alerts update in real time across all of your Mirth Connect and OIE instances at once.
